DASHBOARDS
Dashboards is where the answers you've saved get a wall to live on: every asset you save in Chat with Martin appears here, ready to be placed, arranged and formatted into boards. Each tile shows its last known result instantly from cache — with a timestamp saying how old it is — and reruns live the moment you ask.
OPENING IT
Run dvt servein your project and the hub opens on your project's suite port — 46100 unless you've pinned a different suite_port in dvt_project.yml. Click the DASHBOARDS tile, or go straight to the path — every DVT app is a path on that one origin:
$ dvt serve
# then, in the browser:
http://127.0.0.1:46100/dashboards
WHERE TILES COME FROM — SAVE IN CHAT, COMPOSE HERE
This app has no query editor, and that's deliberate: the chat is where assets are born; this is where they live. You ask Martin a question — say, "revenue by region, last 90 days" — he answers with live rows and usually a chart, and you save that answer under a name. The saved asset carries the question, the governed SQL behind it, and the chart Martin proposed.
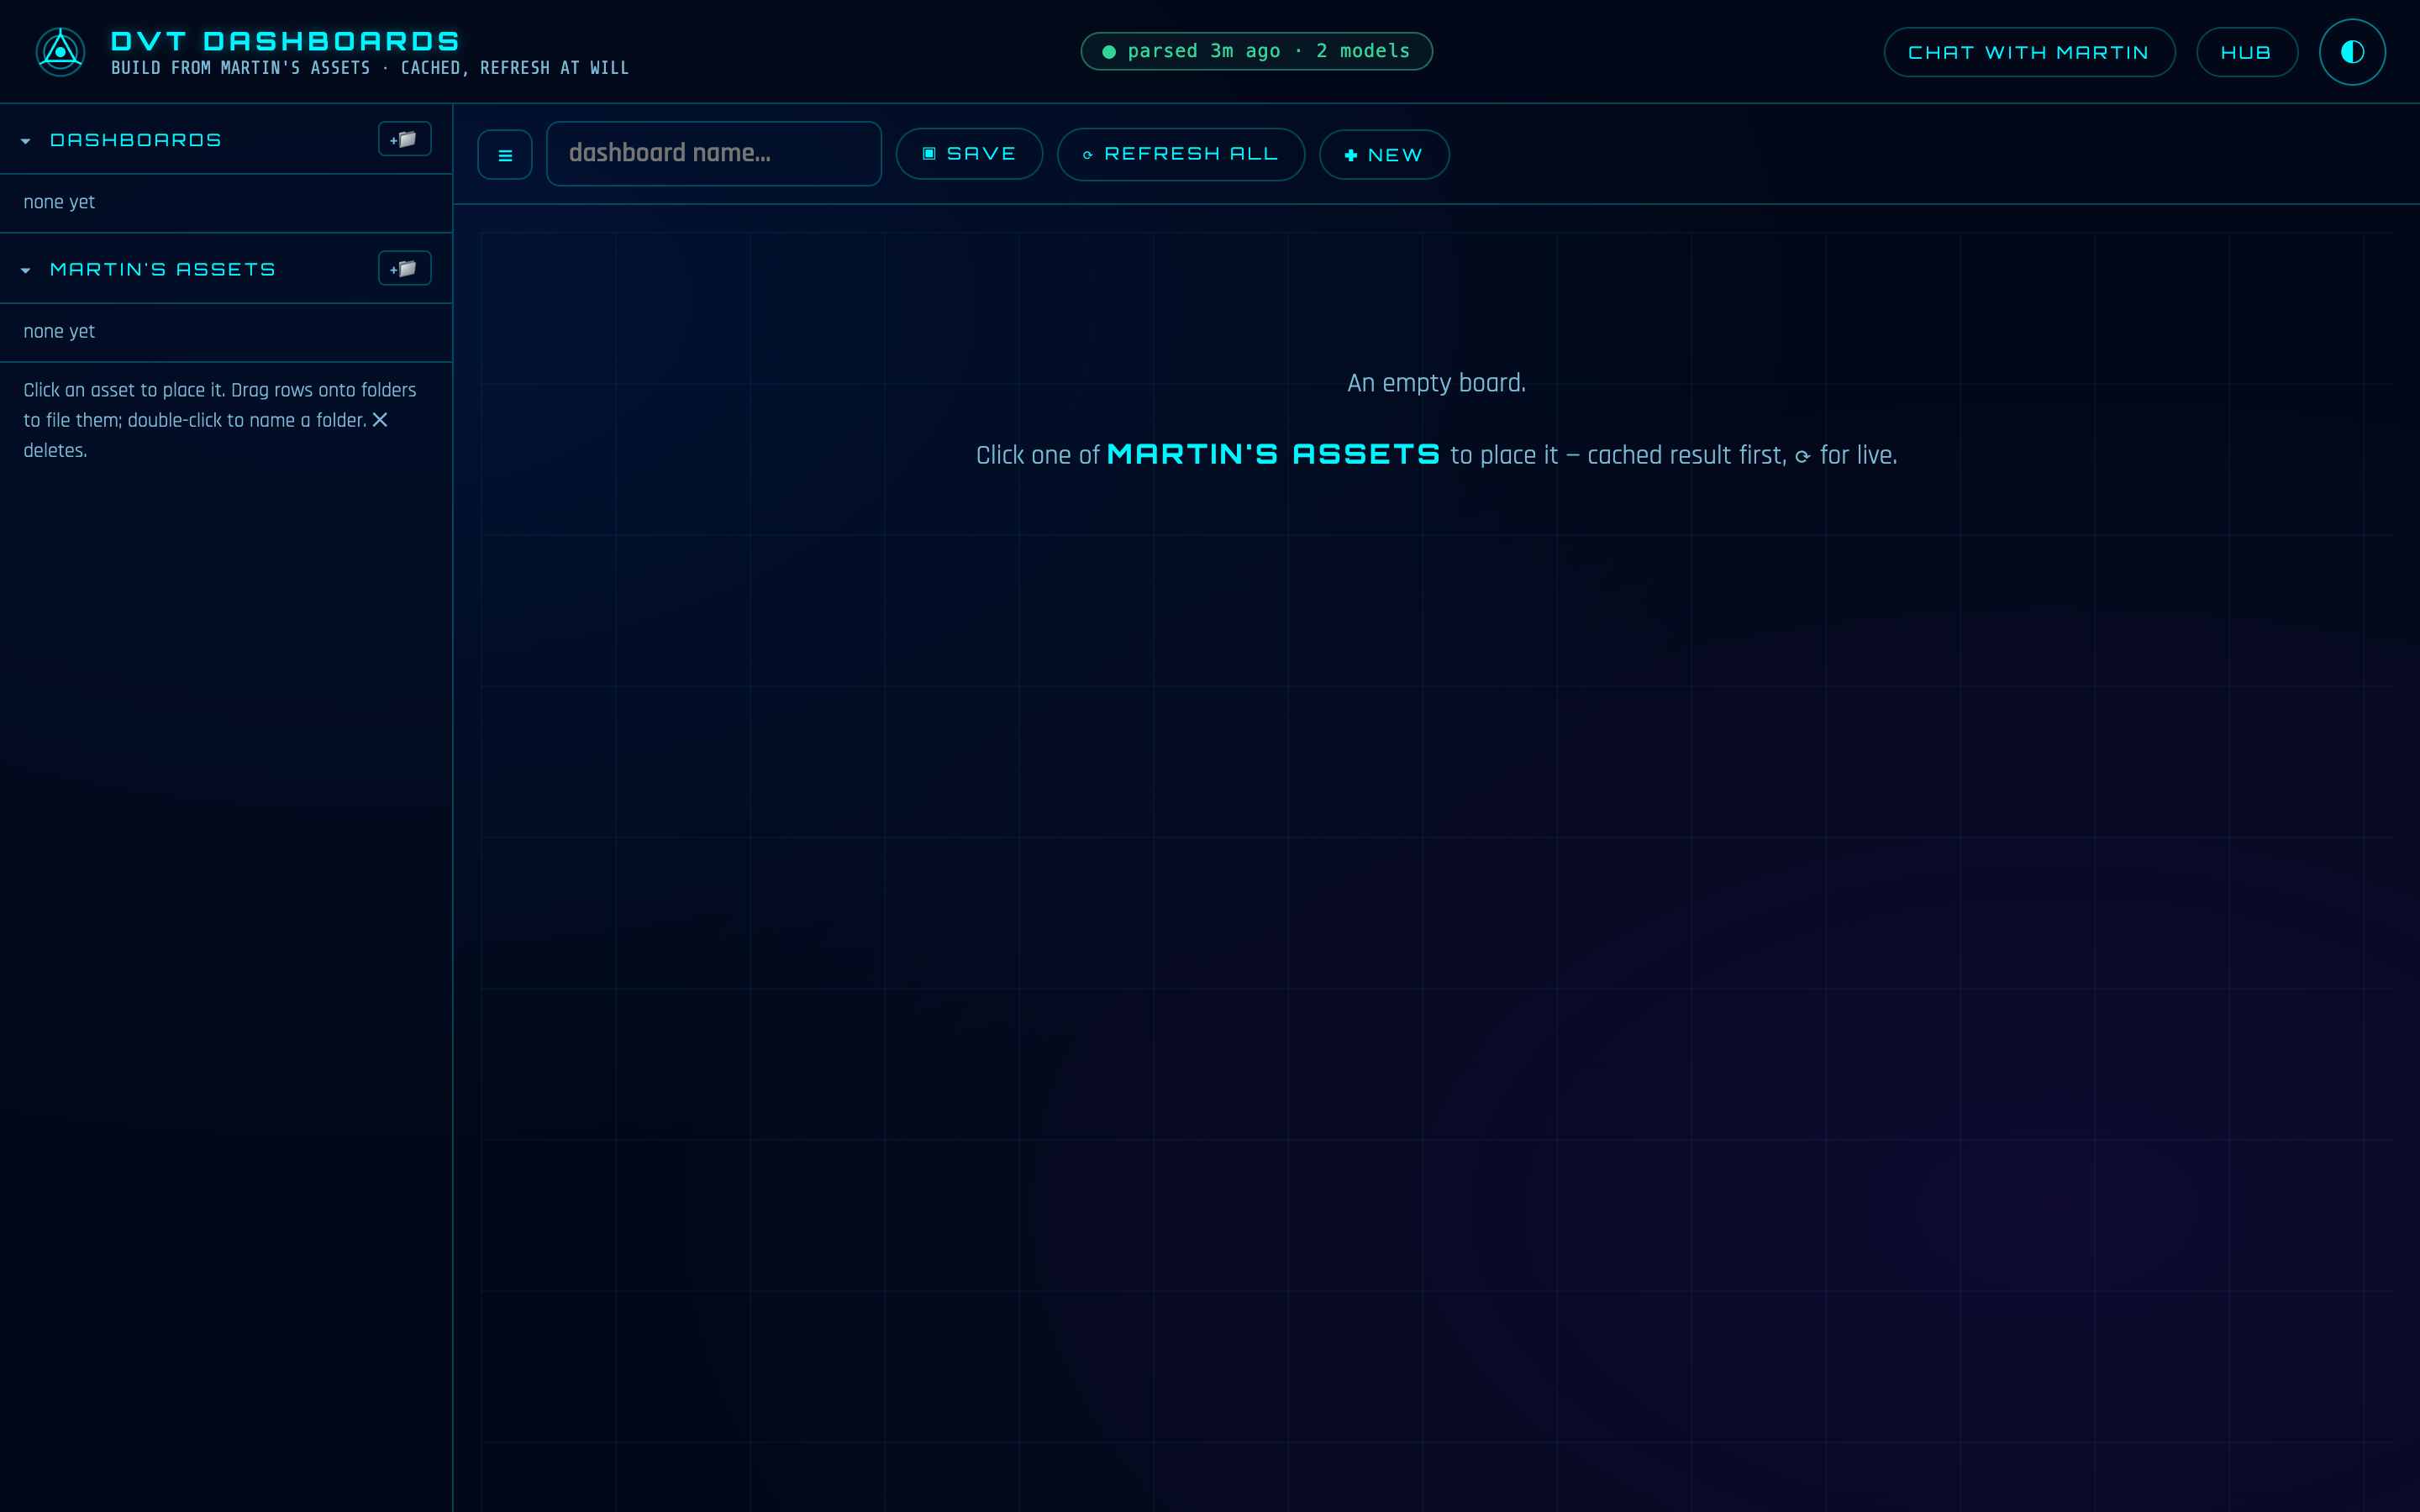
Open Dashboards and that asset is sitting in the left rail under MARTIN'S ASSETS, ready to be placed. Save a handful over a week of asking questions, and composing your Monday-morning board takes about a minute.
ONE STORE, TWO APPS
Assets live in one project-local store that chat and Dashboards share. Deleting an asset here (the ✕ on its row) deletes it everywhere — the app asks before it does.
THE EXPLORER RAIL — BOARDS AND ASSETS, IN FOLDERS
The left rail has two sections: DASHBOARDS (your saved boards, newest first) and MARTIN'S ASSETS (everything saved from chat, each row tagged with what it renders as — a chart type, a table, or html). Both sections organize the same way:
+📁in a section header creates a folder. An empty folder says drag rows here until something lands in it.- Drag any row onto a folder to file it. Drop it on the strip at the bottom of the section to un-file it again.
- Double-click a row to type its folder name directly — handy when the folder doesn't exist yet.
- Click a folder to fold or unfold it;
✕on a row deletes the board or asset (with a confirmation).
THE BOARD — CLICK TO PLACE, DRAG TO ARRANGE
Click an asset and it lands on the canvas as a tile, below whatever is already there. The canvas is a 12-column grid: drag a tile by its header to move it, pull the ◢ grip in its corner to resize it. Every tile header carries three small buttons — ⧉ SQL copies the asset's SQL to your clipboard, ⟳ reruns it live, ✕ takes the tile off the board (the asset itself stays saved).
Name the board in the toolbar and hit ▣ SAVE — it needs a name and at least one tile, and holds up to 48. Saving under an existing name updates that board in place. ✚ NEW clears the canvas for a fresh one, and saved boards open from the rail with everything exactly where you left it — layout, titles, colors, chart choices.
A composed board: tiles on the 12-column grid, each showing its cached result and timestamp.
CACHED BY DEFAULT, LIVE ON DEMAND
Opening a board is instant because every tile shows the last known result first, labeled honestly: cached · as of 12m ago. Nothing runs against your sources just because you looked. When you want fresh numbers, ⟳ on one tile — or ⟳ REFRESH ALL in the toolbar — executes the SQL live through the same guarded virtualization path the chat uses, updates the cache, and the tile switches to ● live just now.
The cache keeps up to 500 rows per asset. When a result was bigger than that, the tile says so — showing 500 of 12,340 — instead of quietly presenting a slice as the whole answer.
THE FORMAT PANEL — DATA AND FORMAT
Click a tile to select it and the format panel opens on the right, with two tabs. Under DATA you pick which columns feed the chart: an X axis (the category) and a Y axis (the value), each defaulting to (auto) — the columns Martin chose when the asset was saved.
Under FORMAT you shape how the tile reads: a title of your own (it falls back to the asset name) in three sizes; the display type; single-accent or full-palette colors with a row of swatches; numbers raw or compact (1.2K); and value labels on or off. Hovering a chart shows a tooltip with the exact X and Y values under the cursor. Everything you set here saves with the dashboard, per tile — the same asset can be a cyan bar chart on one board and a compact table on another.
The format panel: DATA picks the columns, FORMAT sets display type, colors, and labels — chart types the columns can't express are greyed out.
CHART TYPES ARE GATED BY YOUR COLUMNS
The DISPLAY ASrow offers AUTO, BAR, LINE, PIE, SCAT and TABLE — but only the ones your data can actually express are clickable. The app looks at the tile's real result, works out which columns are numeric, which look like dates and which are plain categories, and greys out the rest. Hover a greyed option and it tells you plainly: these columns can't express a pie.
- TABLE— always available; it's also the fallback when nothing else fits.
- BAR — needs a numeric measure plus a second column to label the bars.
- LINE— needs a numeric measure, a second column for the X axis, and at least three rows (two points aren't a trend).
- PIE — needs a label column and a numeric measure, with 2 to 24 rows; more slices than that stops being a pie anyone can read.
- SCATTER — needs at least two numeric columns.
AUTOuses the chart Martin proposed when the asset was saved, or a table when he didn't propose one.
HOW IT RELATES TO THE CLI
A tile's data is its asset's SQL, executed against your live sources through DVT's federation engine — the exact path Chat with Martin answers through. Nothing here reads a pre-built dashboards table, and nothing writes to your warehouses.
All state is plain project-local files under .dvt/ (gitignored): chat_saved.json holds the assets, dashboards.json the boards, dash_cache.json the cached results. And like every DVT write surface, rerunning and deleting answer only from the machine the suite runs on — loopback only, regardless of how the suite is hosted.
REFERENCE
- Open at:
/dashboardson the suite port (default46100, pinned bysuite_port) - Started by:
dvt serve— the hub's DASHBOARDS tile links here - Needs: at least one asset saved in Chat with Martin — an empty board tells you exactly that
- State:
.dvt/chat_saved.json,.dvt/dashboards.json,.dvt/dash_cache.json— project-local, gitignored