DATA PROFILING
Data Profiling is the app you open before you model a table you've never met: pick any relation the project knows — a model, a Postgres table, a CSV sitting in a bucket — and one click computes row counts, nulls, distincts, min/max and averages for every column, live. There's no profiling package to install and nothing gets added to your DAG: if DVT can federate it, DVT can profile it.
OPENING THE APP
Run dvt serveand the hub opens on your project's suite port (46100 unless suite_port in dvt_project.yml says otherwise). Data Profiling is one of the tiles — or go straight to /profiling:
$ dvt serve
# then open http://localhost:46100/profiling
The header carries the same chrome as every DVT app: the hub button to jump back, the project pill, and the light/dark toggle that follows you across the whole suite.
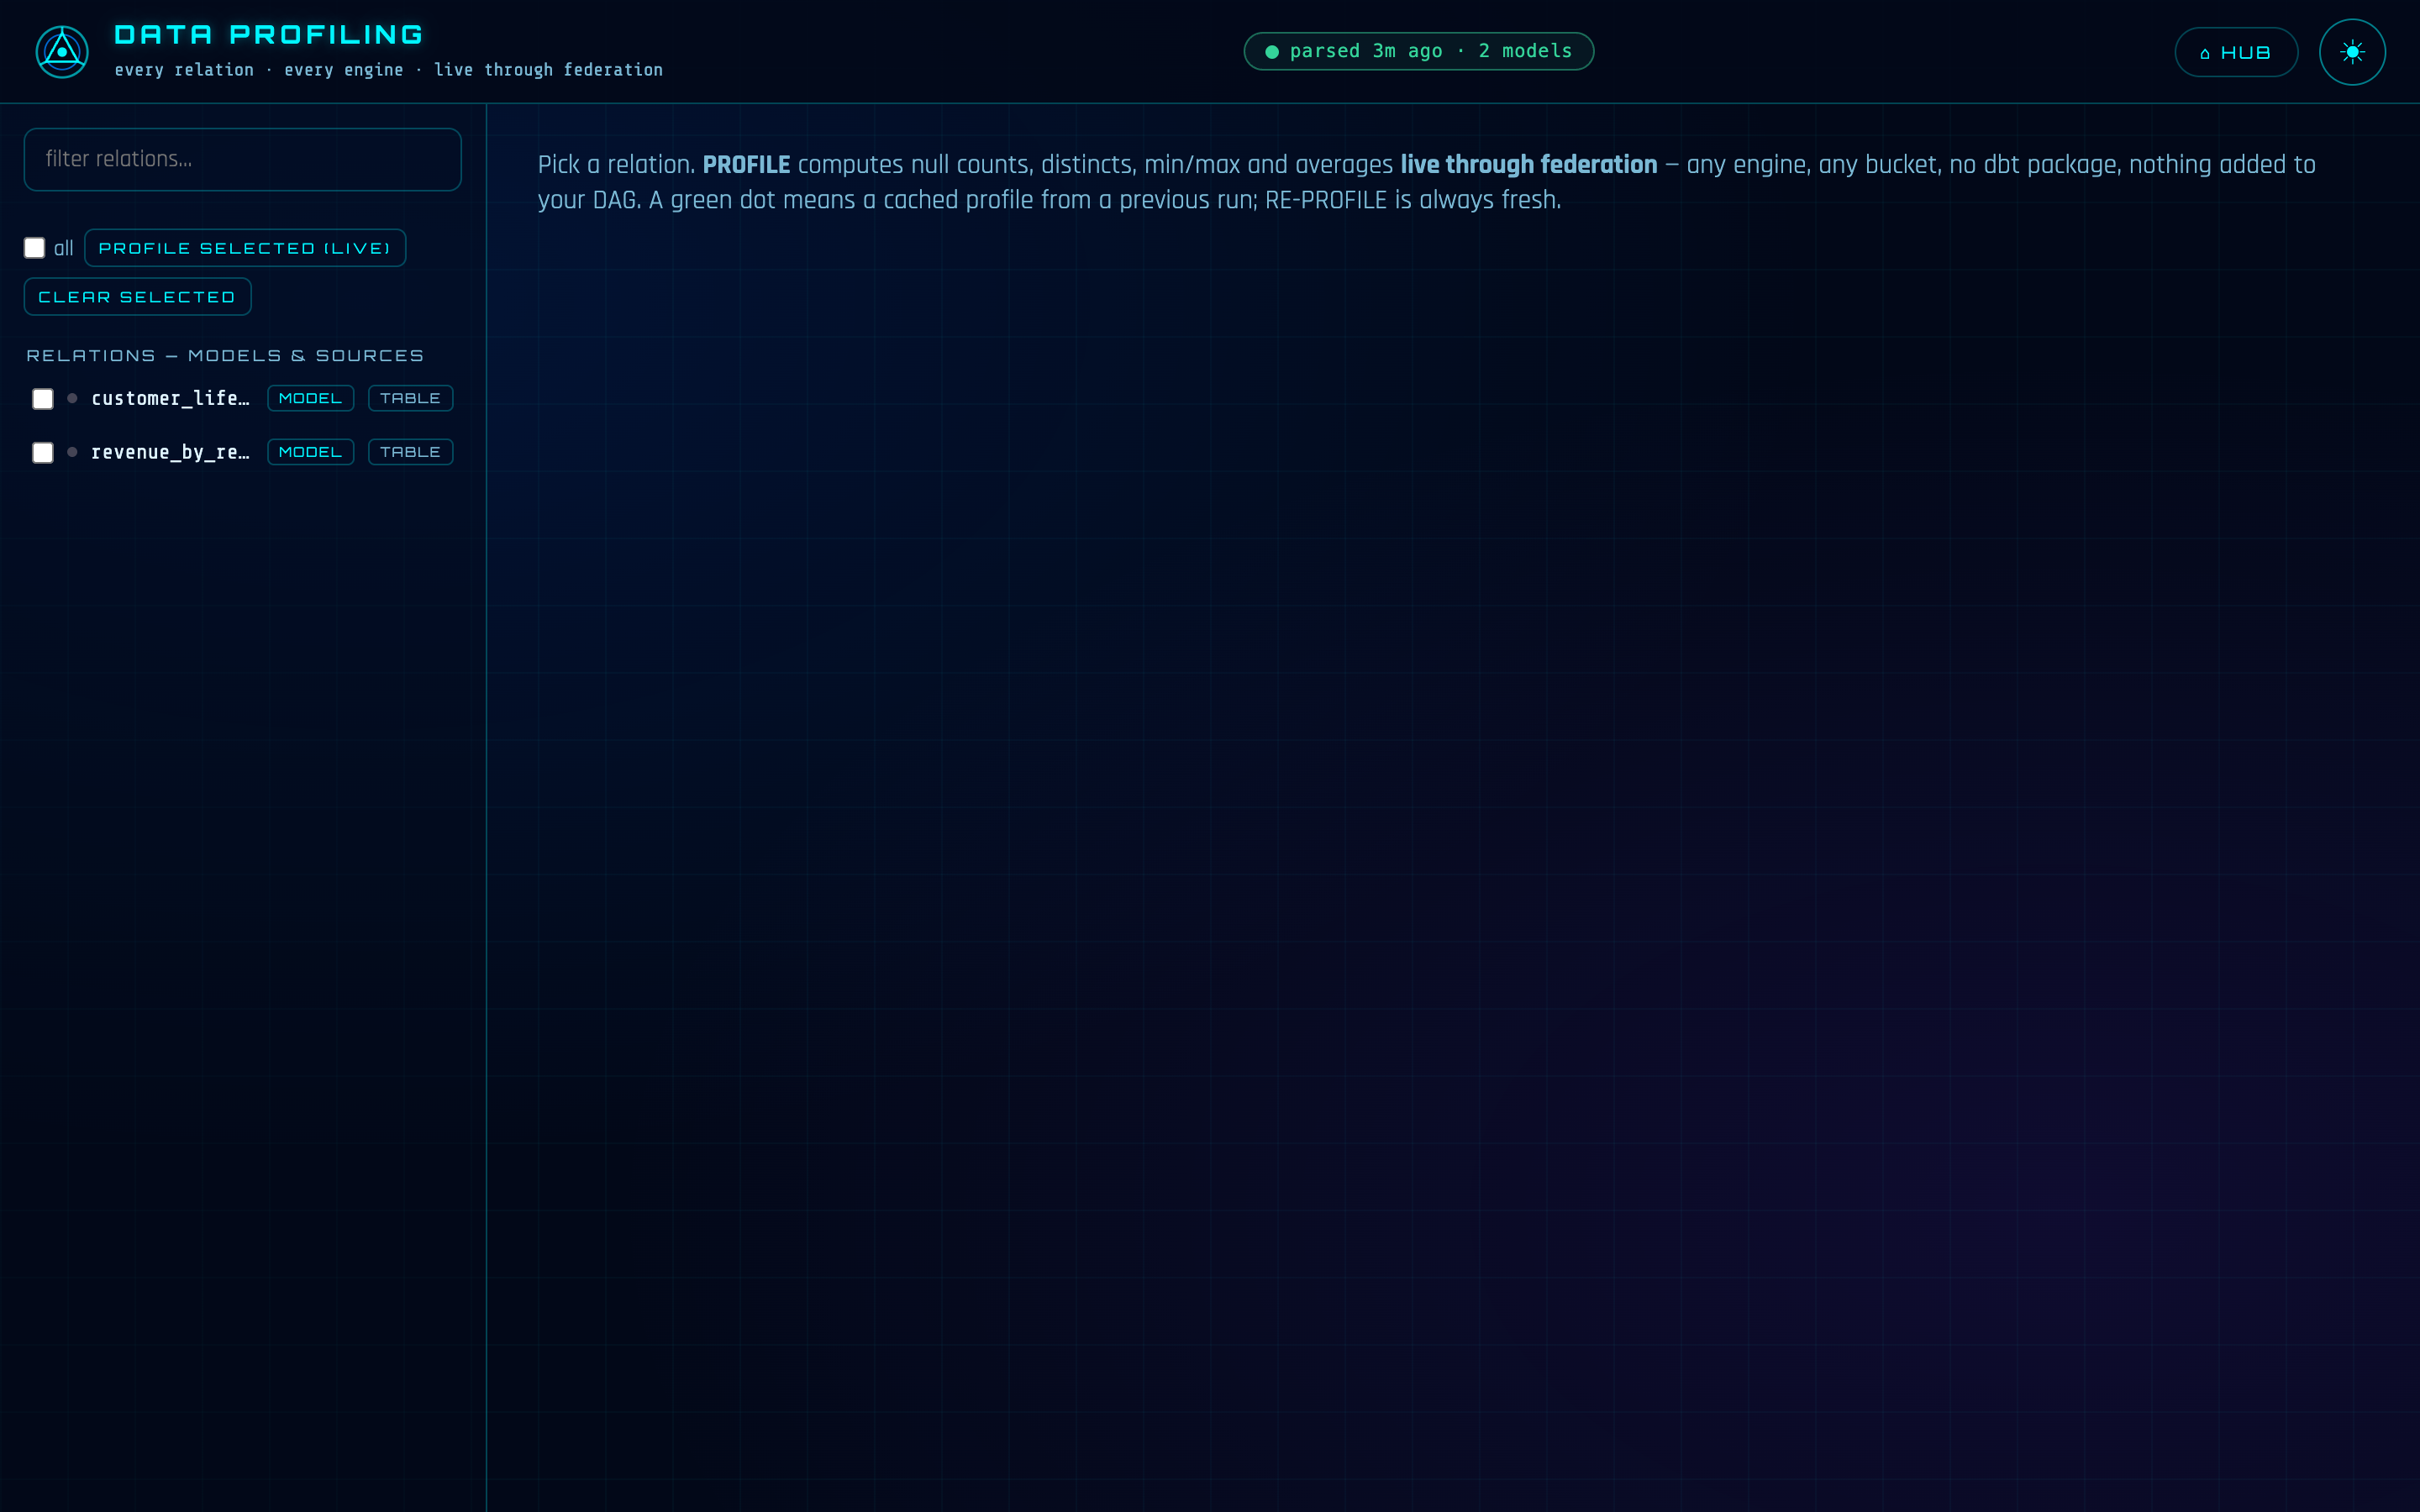
THE RELATION LIST — EVERYTHING THE PROJECT KNOWS
The left panel lists every profilable relation: models by their bare name, sources as source_name.table. Each row is tagged with what it is (MODEL or SOURCE) and where it lives (TABLE on a database engine, FILE for CSVs, Parquet and friends in buckets or on disk). A filter box narrows the list as you type.
The dot next to each name is its status at a glance: green means a cached profile from a previous run is ready to view, redmeans the last attempt failed (hover for the reason), and a pulsing dot means it's being profiled right now.
PROFILING ONE RELATION
Say you've just wired up a new source and want to know what you're dealing with before writing the first staging model. Click the relation: the main pane shows what it is, where it's stored, how many columns the catalog knows about, and when it was last profiled — never profiled, if this is your first look. Hit PROFILE (LIVE) and the statistics come back as one table:
- Rows — the total row count, up top.
- Nulls— count and percentage per column. A column that's 40% null is a join key you don't want.
- Distinct — distinct values per column. Distinct equal to the row count says unique key; distinct of 3 on a million rows says category.
- Min / Max — for anything orderable: numbers, text, dates, booleans. The fastest way to spot a date column that starts in 1970 or an amount that goes negative.
- Avg — for numeric columns.
The app is type-aware about what it asks for: nested and JSON-ish columns get nulls and distincts only, and LOB columns (CLOB/BLOB and kin) get null counts only — the statistics that would error on that type are simply not requested, so a profile never fails because one exotic column exists. Very wide tables profile their first 48 columns, and the result says so.
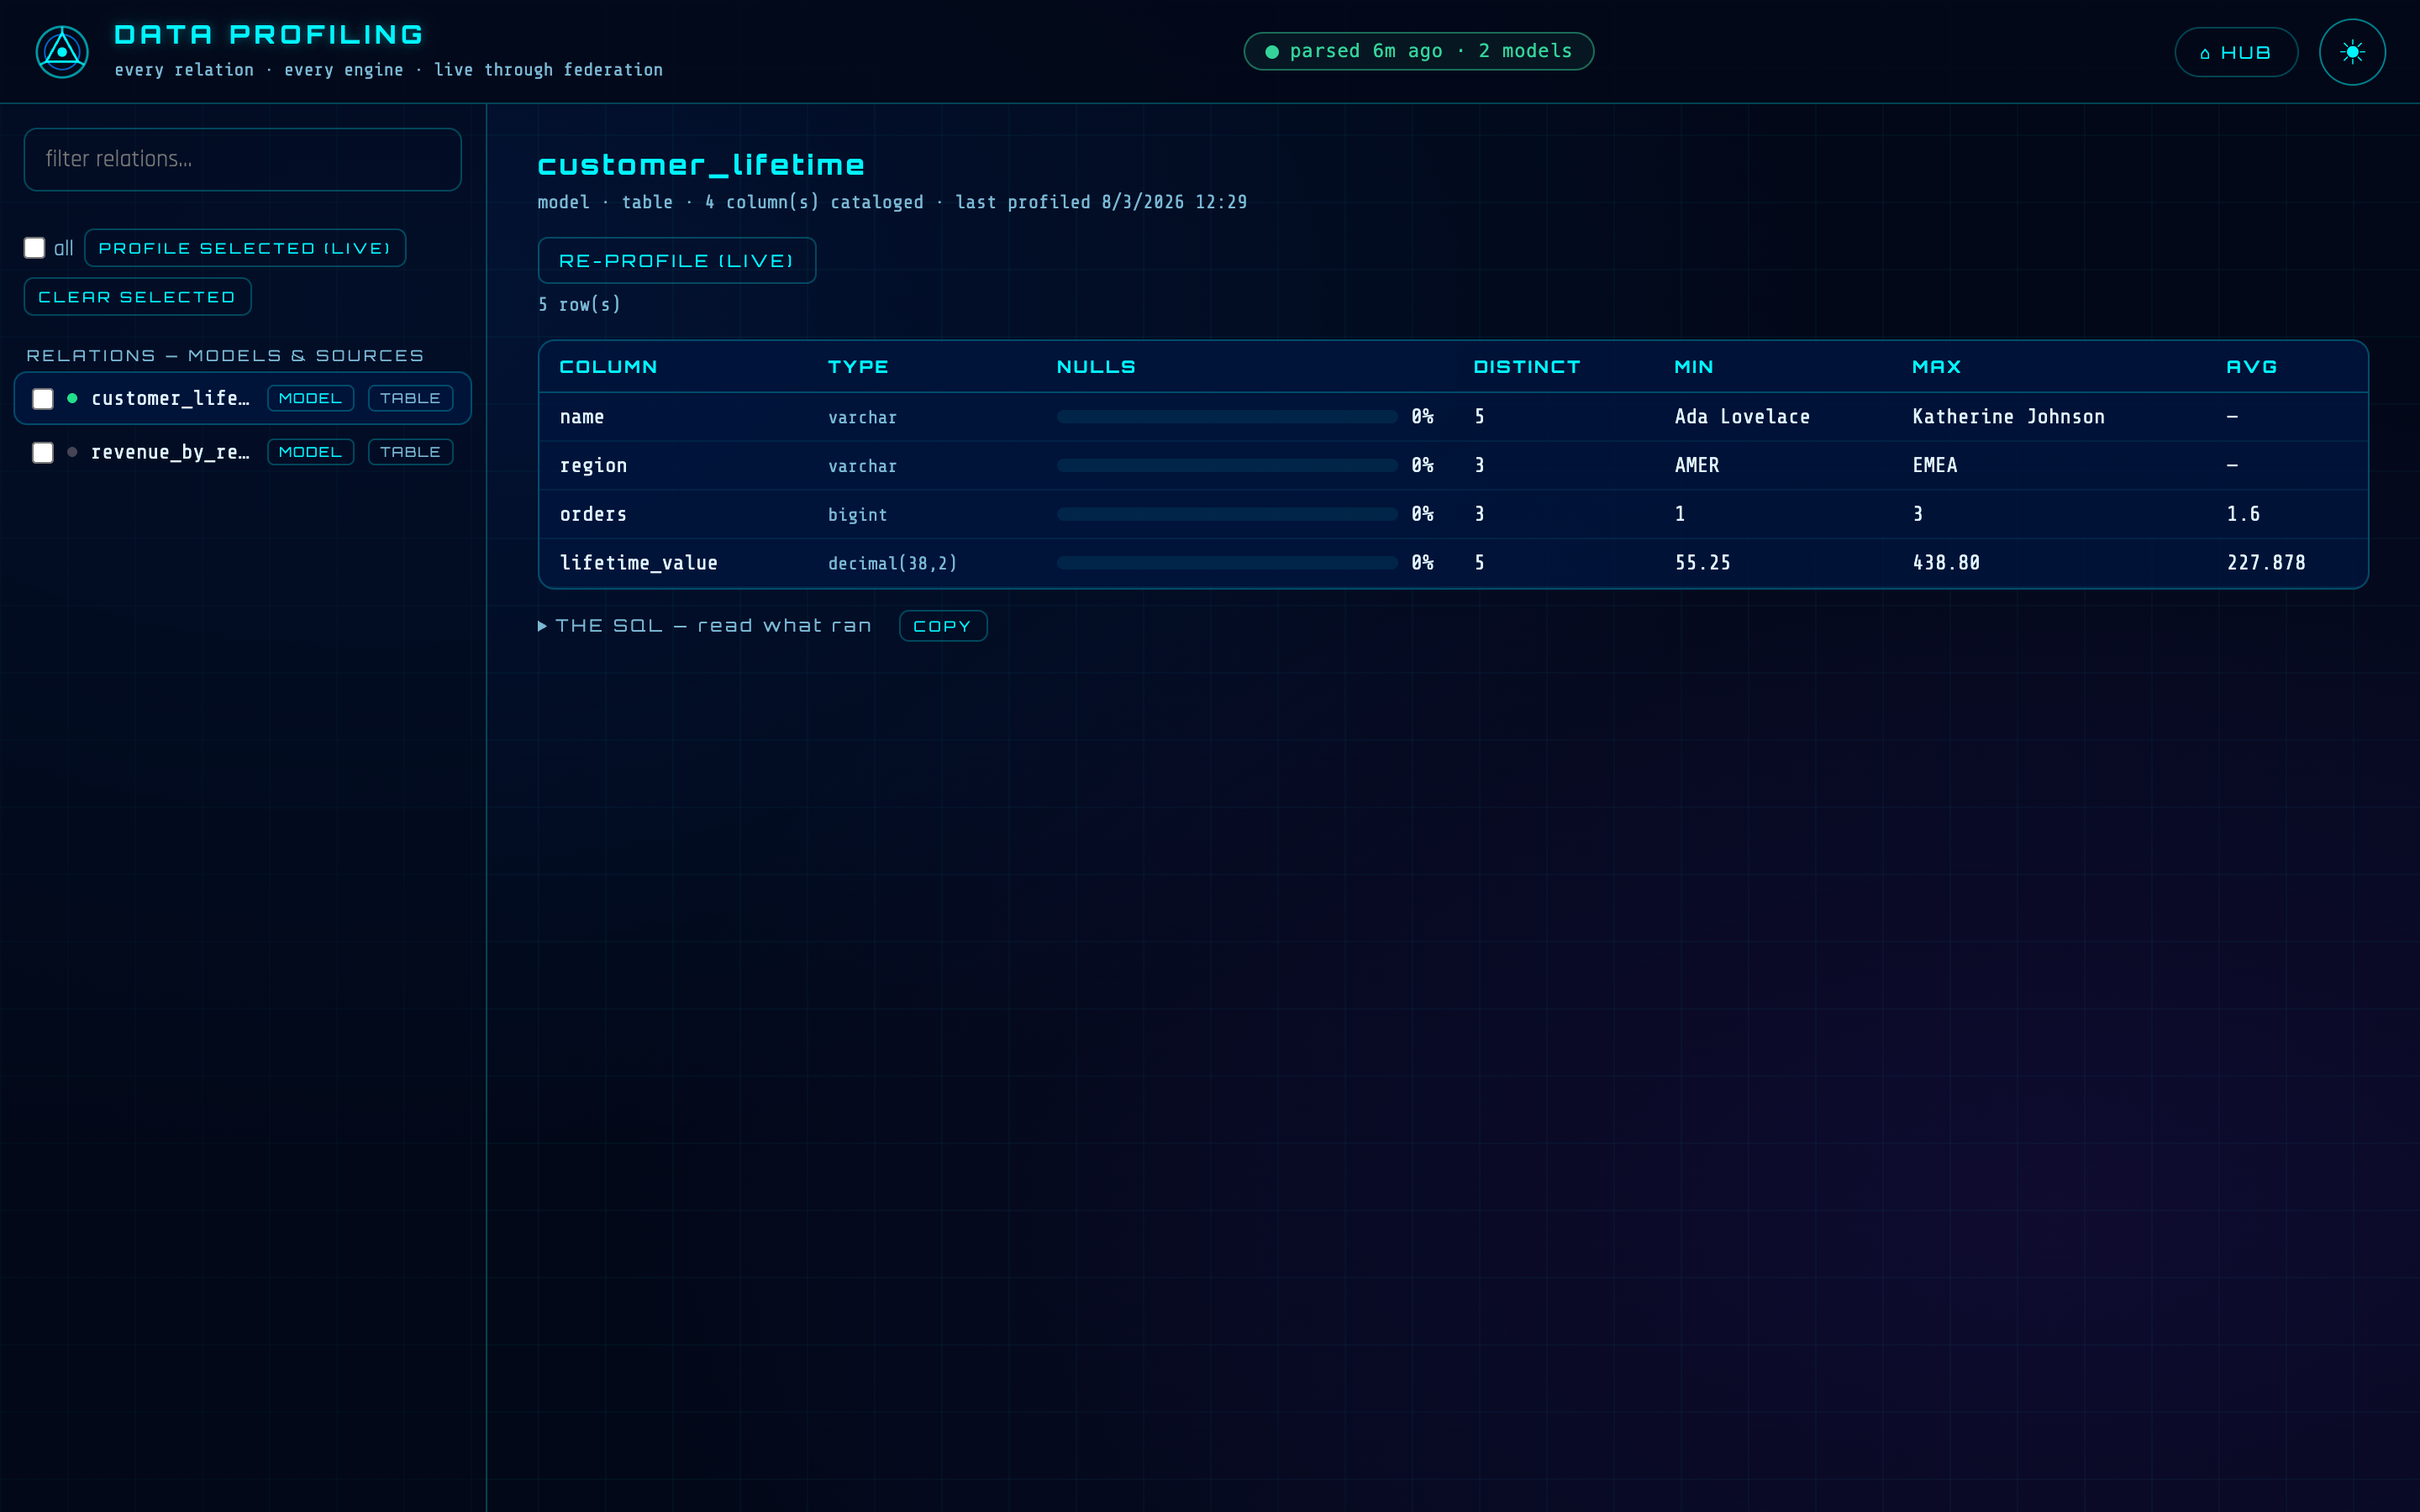
Once a profile exists the button reads RE-PROFILE (LIVE) — cached results are for reading, a re-profile always goes back to the source.
BATCH PROFILING — THE WHOLE SOURCE AT ONCE
Meeting a new schema is rarely about one table. Tick the checkboxes next to the relations you care about (or tick all) and hit PROFILE SELECTED (LIVE): the app works through the queue four at a time, the dots pulse as each relation is in flight, and a progress note counts them down. ■ STOP halts the queue; CLEAR SELECTED drops cached profiles you no longer want.
Batch profiling a new source: selected relations queue up and profile four at a time.
WHERE THE NUMBERS COME FROM
Each profile is one wide aggregate query, executed through the same live federation path that Chat and the API Portal use. For a database table that means the query is transpiled into that engine's own dialect and the engine computes it — a single row of statistics crosses the wire, not your data. Files and bucket relations have no engine to ask, so DuckDB computes those locally. Either way the numbers describe the source as it is right now.
Results are cached in .dvt/profiles.json, so the app opens showing everything you learned last time — with its timestamp, so you know how old each profile is. And if the catalog has no column metadata for a relation (or its spelling has drifted), the app quietly discovers the columns live with a one-row sample and carries on instead of refusing.
LIVE MEANS LIVE
Profiling touches your real sources, which is exactly the point — and why profiling runs only answer from the local machine, like every write-shaped action in the suite. A big table on a busy warehouse pays one aggregate query per profile.
FROM THE CLI
The relation list comes from your project's manifest — run dvt compile once and every model and source appears. Column names and types come from the catalog that dvt docs generate writes; that step is worth doing but not required, because missing columns are discovered live. The profiles themselves live in .dvt/profiles.jsonbeside your project's other local state.
REFERENCE
| WHERE | /profiling on the suite port (suite_port in dvt_project.yml, default 46100) |
| START | dvt serve (the whole suite; dvt kill stops it) |
| NEEDS | dvt compile (relation list); dvt docs generate optional — columns discover live |
| COMPUTES | row count; per column: nulls + %, distinct, min/max (orderable), avg (numeric) |
| CACHE | .dvt/profiles.json — shown on open; RE-PROFILE is always fresh |
| SECURITY | profiling runs answer from the local machine only |